Visualization of Text Annotations over Time
I've been passionate about annotation and modes or reading, skimming, and retention as related to reading and annotation for a long time.
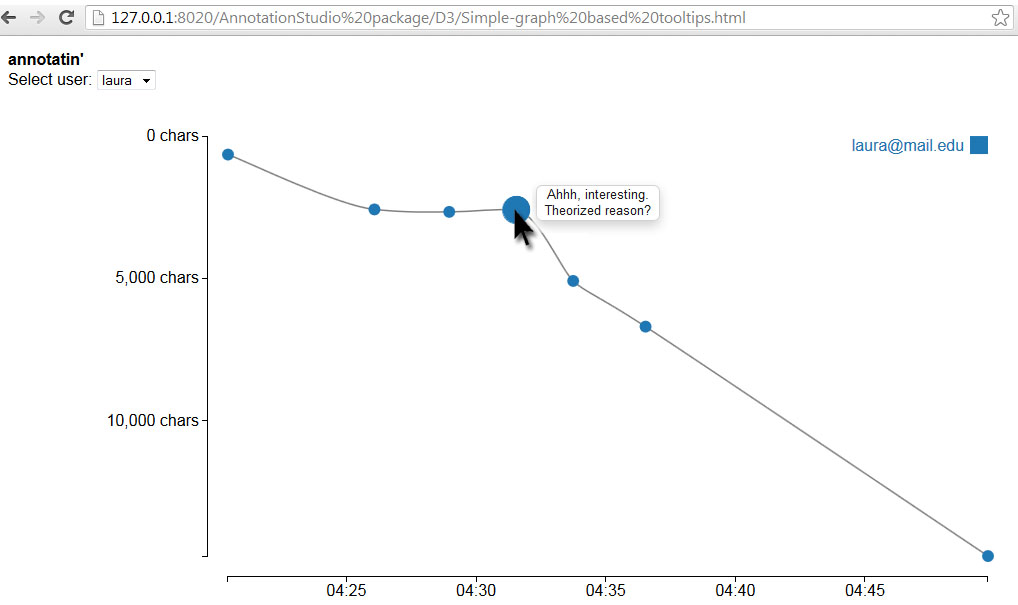
In this project, I used data from Annotation Studio - an open source digital annotation tool - to visualize users’ reading paths.
It was fascinating to see how even such a crude visualization yilded useful insights (for example, if one were a teacher, this would quickly help identify students who are likely to be low on comprehension.)
I even got to present my crude findings under the title “Temporal Aspect of Annotating” at “Convergence @Harvard” conference.
The original code was written in some old version of Processing. I still have a backup, but need to play with it more to run it in some compatibility mode to get fresh screenshots.
This images is actually from a D3.js implementation I tried to integrate into Annotation Studio itself. D3.js is incredibly powerful, but for a javascript novice like myself, it was way too much. Suffice to say, I failed. I got some prototypes working, but never polished it enough for production.
May this inspire someone somewhere.